library(lattice)
作図,
ど忘れ対策メモ.
library(lattice)
Depth <- equal.count(quakes$depth, number=8, overlap=.1)
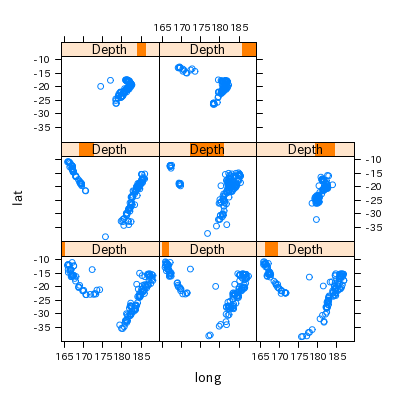
xyplot(lat ~ long | Depth, data = quakes)
だとこうなるけど (xyplot() の example):

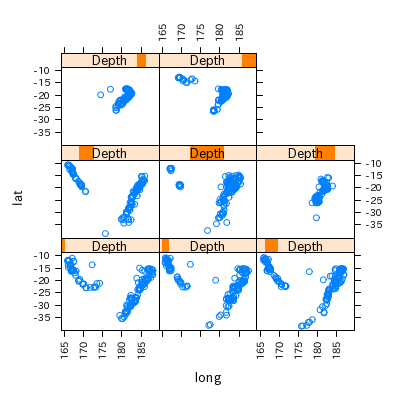
xyplot(lat ~ long | Depth, data = quakes, scales = list(x = list(rot = 90)))

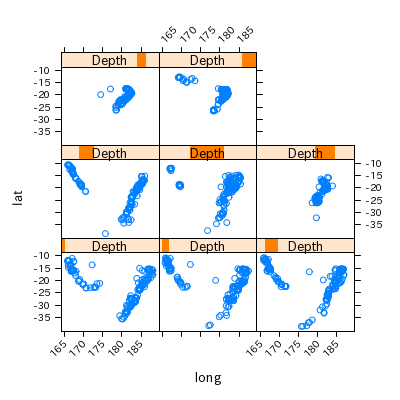
xyplot(lat ~ long | Depth, data = quakes, scales = list(x = list(rot = 45)))Y 軸のラベルの場合は
scales = list(...)
内に
y = list(rot = 45)
を追加すれば OK.
