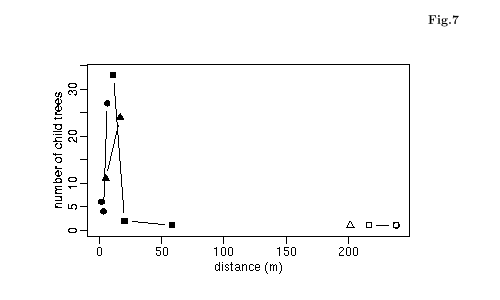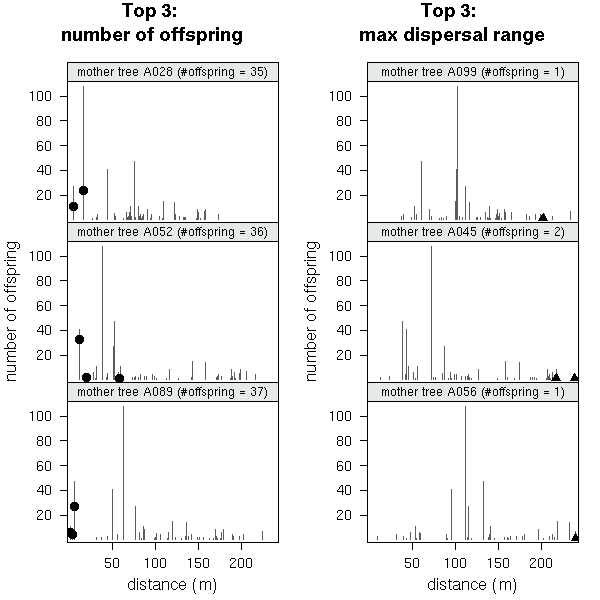

xyplot()
とかでちょっと描いてみるのは意外と簡単なんだけど,
カスタマイズしようとすると
xyplot(..., strip = ..., panel = ...)
と指定しなければならず,
さらにこの stript & panel 関数それぞれに
独特の引数
(それぞれ which.panel& subscripts)
あったりして,
なかなかややこしいね
……
scales
とかだろうか.
xyplot(
	n.offspring ~ distance | mother,
	data = data,
	layout = c(1, 3),
	...
	scales = list(
		alternating = 1, # axes location bottom/left
		tck = c(1, 0) # ticks length, bottom/left and top/right
	),
	...
)

postscript()
や pdf()
関数は width や height
をインチで指定するんだけど,
これのメートル換算がときどき面倒になり,
こんにちではありがたいことに
google で計算
できたりする.