えーと,
てきとうに例題を作って
fit1 <- lmer(y ~ (1 | group), family = binomial, method = "Laplace", ...) # glmer オブジェクト
をやると
Generalized linear mixed model fit using Laplace
Formula: y ~ (1 | group)
 Family: binomial(logit link)
  AIC  BIC logLik deviance
 1385 1395   -690     1381
Random effects:
 Groups Name        Variance Std.Dev.
 group  (Intercept) 0.0353   0.188
number of obs: 1000, groups: group, 10

Estimated scale (compare to  1 )  0.9976

Fixed effects:
            Estimate Std. Error z value Pr(>|z|)
(Intercept)    0.108      0.087    1.24     0.22
となり,
さらに
mcmc1 <- mcmcsamp(fit1, n = 500) # library(coda) の mcmc オブジェクト
やってから
(library(coda)
も忘れず実行)
summary(mcmc1)
やると
Iterations = 1:500
Thinning interval = 1
Number of chains = 1
Sample size per chain = 500

1. Empirical mean and standard deviation for each variable,
   plus standard error of the mean:

                   Mean     SD Naive SE Time-series SE
(Intercept)       0.109 0.0999  0.00447        0.00528
log(grop.(In))   -3.391 1.1070  0.04951        0.14390
deviance       1385.842 6.2637  0.28012        0.47325

2. Quantiles for each variable:

                   2.5%       25%      50%      75%    97.5%
(Intercept)      -0.084    0.0474    0.104    0.169    0.318
log(grop.(In))   -6.022   -3.9808   -3.269   -2.629   -1.521
deviance       1375.724 1381.4101 1385.200 1389.406 1399.566
で fit1 と summary(mcmc1)
を比べてよーやくわかったんだけど,
MCMC 計算の結果に含まれてる
log(grop.(In))
ってのは group の random effects
(つまり group 差)
あらわす事後分布の分散の log
になってるわけね.
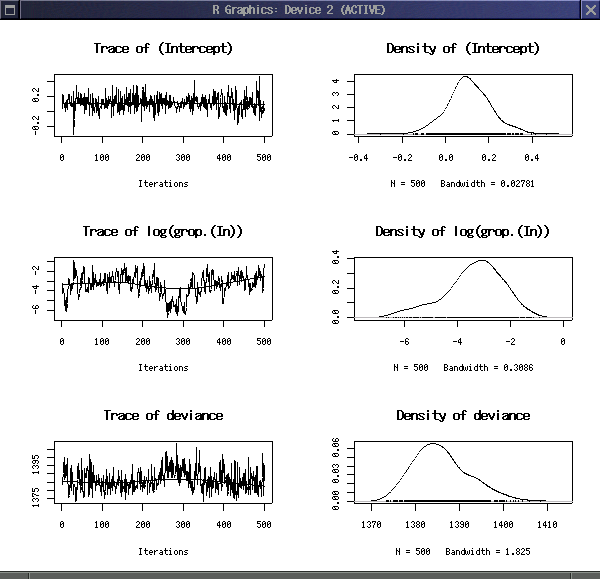
plot(mcmc1)
すると,
いつものごときこういう図になるわけで.

