ggplot2
を使った作図練習にはまりこんでしまった
……
(
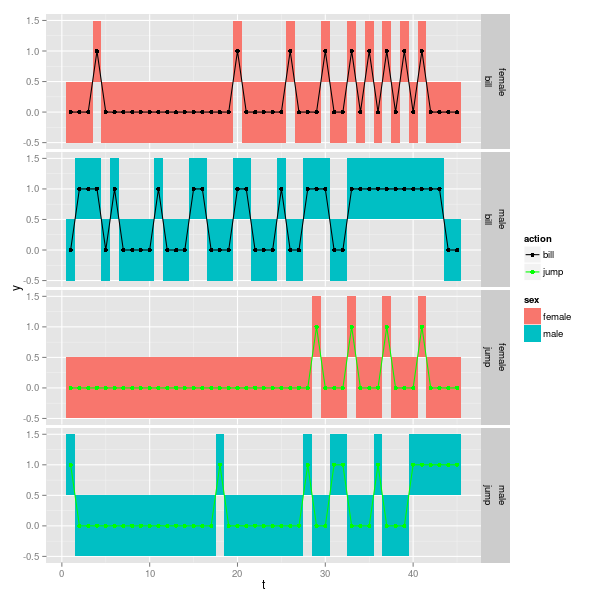
ggplot(dl, aes(x = t, y = y))
+ geom_tile(aes(fill = sex))
+ facet_grid(action + sex ~ .)
+ geom_line(aes(color = action))
+ geom_point(aes(color = action))
+ scale_color_manual(values = c("black", "green"))
)