問題の要点は
-
R の中で日付は
Date
クラスであつかう
-
しかし
Date
では時刻をあつかえない
(あとでよく調べる必要あるけど ……たぶんまちがいない)
-
時刻までふくむ場合は
POSIXlt
(または POSIXct)
クラスを使う
-
しかし lattice 作図の横軸なんかで,
POSIXlt
は使えない
……
as.numeric()
する必要ある.
-
as.numeric()
すると
UNIX 時間
つまり 1970-01-01 00:00:00 からの秒数となる.
-
したがって lattice 作図のときには,
軸ラベルを自作する必要がある
……
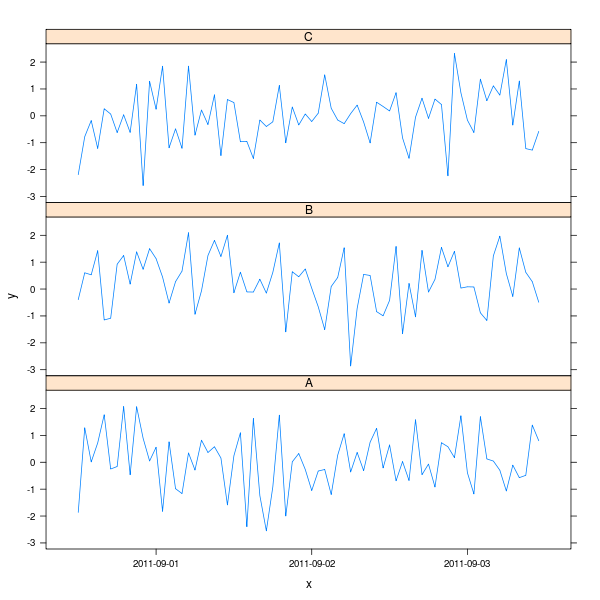
とゆーことでやってみた回答例.
各日付の目盛は 12:00:00 につけている.
library(lattice)
# 架空データ生成
n.id <- 3
n.date <- 3
n.time <- 24
d <- data.frame(y = rnorm(n.id * n.date * n.time))
d$date <- sprintf("2011/09/%02i", rep(1:n.date, each = n.date * n.time))
d$time <- sprintf("%02i:00:00", rep(0:(n.time - 1), each = n.date))
d$id <- LETTERS[rep(1:n.id, n.date * n.time)]
d$x <- as.POSIXlt(paste(d$date, d$time)) # POSIX な時間クラス

# lattice 作図
at.x <- as.numeric(as.POSIXlt(sprintf("2011/09/%02i 12:00:00", 1:n.date)))
xyp <- xyplot(
	y ~ as.numeric(x) | id, # as.numeric が必要
	data = d,
	type = "l",
	xlab = "x",
	scales = list(
		x = list( # X 軸
			alternating = 1,
			tck = c(1, 0),
			relation = "same",
			at = at.x,
			labels = sprintf("2011-09-%02i", 1:3)
		),
		y = list(alternating = 1) # Y 軸
	),
	layout = c(1, 3)
)
print(xyp)

